Introduction
The current stock market trends in September 2026 tell a surprisingly complicated story. On the surface, all three major US indexes are up significantly for the year—the Nasdaq leads with roughly 16% year-to-date gains, the S&P 500 sits around 11%, and the Dow has climbed approximately 6%. But beneath those headline numbers, the market is wrestling with three serious headwinds: inflation that won’t fall to the Fed’s 2% target, geopolitical risk from the ongoing Iran conflict, and a Federal Reserve that markets increasingly expect to hike rates again in September. Here’s the complete picture—with real numbers, not estimates.
Where the Major Indexes Stand Right Now
As of August 21, 2026, the S&P 500 stood at 7,674.37, the Nasdaq Composite at 26,180.45, and the Dow Jones Industrial Average at 53,277.01.
For the full month of August, the S&P 500 gained 2.5%, the Nasdaq 100 jumped 3.8%, and the Dow rose 1.4%. However, these monthly gains mask significant intra-month volatility driven by conflicting economic signals.
Through the end of May 2026, the tech-heavy Nasdaq saw a year-to-date gain of about 16%, the S&P 500 followed with a gain of about 11%, and the Dow saw a YTD increase of about 6%.
Where each index stands as a narrative:
The Nasdaq’s outperformance reflects AI-driven technology spending. The S&P 500’s middle-ground performance reflects the broader economy—strong in tech, weaker elsewhere. The Dow’s underperformance reflects that its 30 industrial and consumer stocks are more sensitive to inflation and interest rate fears.
In a widely recognized milestone, the Dow crossed 50,000 for the first time on February 6, then corrected approximately 10% from the peak by late March as conflict in Iran escalated and inflation concerns mounted. The index has since staged a recovery, retaking the 50,000 level in mid-May, before consolidating at a record close of 51,032.46 on May 29.
“For real-time updates on where these indexes trade minute-by-minute, CNBC Markets provides live pricing, sector performance, and breaking market news throughout every trading session
The Three Forces Driving Current Stock Market Trends
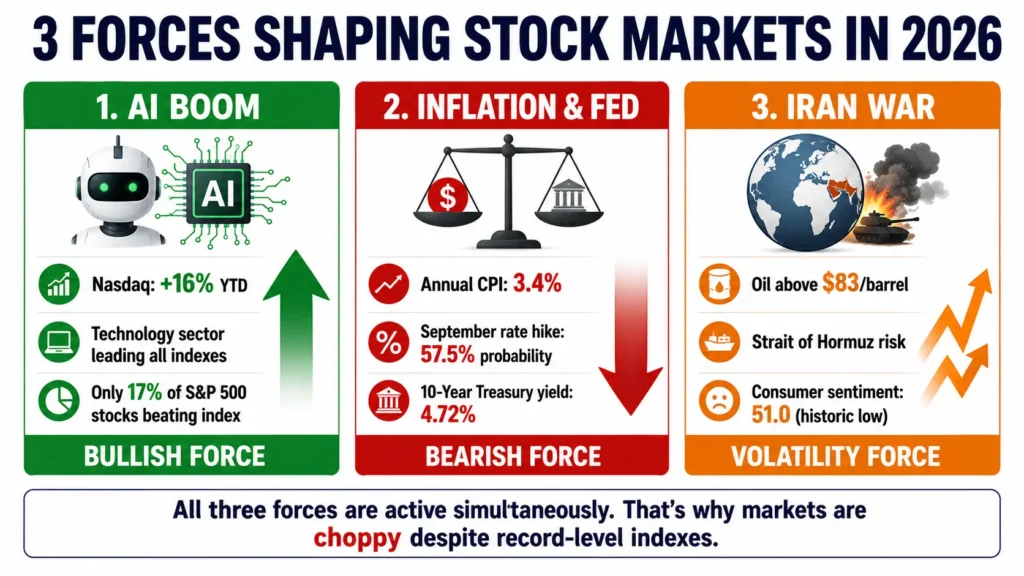
Understanding current stock market trends requires understanding the three forces pulling markets in different directions.
Force 1 — The AI Capital Spending Boom
The S&P 500 is up 7.7% so far in 2026, driven largely by a massive AI capital spending boom that has overshadowed concerns about rising inflation and tariffs.
AI isn’t just a story—it’s showing up in real corporate earnings. Technology companies building data center infrastructure, semiconductor companies supplying AI chips, and software companies monetizing AI tools have all reported stronger-than-expected earnings in the first half of 2026.
If current trends continue, sectors such as memory chips and servers for AI data centers are likely to do well for the rest of the year.
The important caveat: AI concentration is creating a narrow market. Only about 17% of stocks in the S&P 500 have outperformed the index over the past month, one of the lowest readings in the past decade. That means AI stocks are carrying the index while most other stocks lag behind.
Technology sector strength creates dividend income opportunities in established tech companies — our passive income guide shows how to capture this
Force 2 — Inflation and Federal Reserve Uncertainty
This is the biggest risk factor in current stock market trends.
July’s consumer price index showed headline inflation rising 0.1% on the month, with the annual rate landing at 3.4%. Core CPI, which excludes food and energy, advanced 0.2% last month and 2.5% on the year.
While July inflation cooled slightly, August looks more concerning. Fed Chair Kevin Warsh warned at the Jackson Hole symposium: “While this summer’s PCE and CPI readings were better than expected, they do not tell me that underlying trends have meaningfully improved.” Warsh also said inflation should decline gradually over a reasonable period toward the central bank’s 2% target.
Markets reacted immediately. Following Warsh’s remarks, the CME Fedwatch interest rate derivative tool showed a 57.5% probability that the central bank will raise the Fed funds rate by 25 basis points to the 3.75-4% range in September. This probability was 35.4% just a day ago.
Treasury yields moved sharply higher following Warsh’s remarks. The 2-year Treasury yield gained 0.12 percentage points, finishing at 4.35%, while the 10-year yield rose to 4.72%.
Higher Treasury yields directly compete with stocks for investor dollars—and they make borrowing more expensive for companies, reducing future earnings. This is why current stock market trends show sensitivity to every Fed statement.
Force 3 — Iran War and Geopolitical Risk
The Iran conflict has become one of the defining macro risks shaping current stock market trends throughout 2026.
US stock indices fell on Monday as higher oil prices added to inflation risks and consolidated concerns of an incoming rate hike by the Federal Reserve. The S&P 500 and Nasdaq 100 fell 0.3%, while the Dow dropped over 0.5%. Wholesale prices for oil and products gained traction after the US and Iran delivered fresh strikes against each other.
Energy is a sector to watch due to the Iran war and demand for energy to fuel AI data centers. The war has kept oil prices elevated, which feeds directly into inflation—creating a vicious cycle where geopolitical risk pushes energy prices higher, inflation rises, and the Fed is pressured to raise rates, which then weighs on stocks.
A more sustainable broadening out of market performance—like what was seen pre-Iran war—would likely require an end to the war and a “permanent” re-opening of the Strait of Hormuz.
Winners and Losers in 2026
Not all sectors are experiencing the same current stock market trends. The divergence between sectors is significant.
Leading Sectors
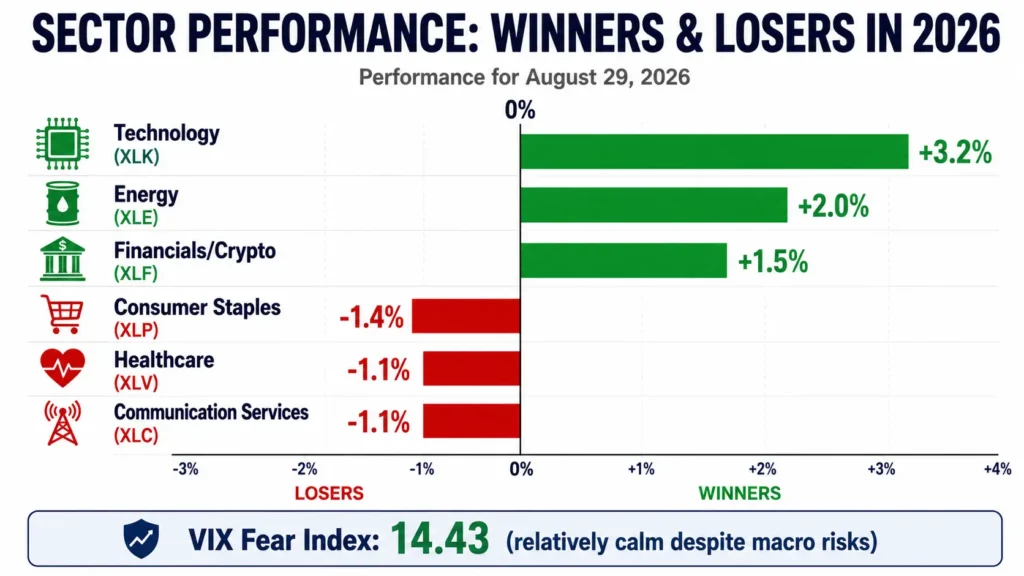
The Information Technology Select Sector SPDR (XLK) rose 3.2% on August 29. Technology has been the consistent leader throughout 2026, driven by AI infrastructure spending, cloud computing demand, and semiconductor earnings beats.
Energy has been a stealth winner. With oil prices elevated due to the Iran conflict and AI data centers driving unprecedented electricity demand, energy companies are benefiting from both geopolitical risk and secular technology demand simultaneously.
The financials sector boosted the broader market, with crypto-related stocks posting sizable gains as bitcoin advanced 22% for the week. Robinhood shares jumped almost 14%, while Coinbase added 8%.
Lagging Sectors
The Consumer Staples Select Sector SPDR (XLP), the Health Care Select Sector SPDR (XLV), and the Communication Services Select Sector SPDR (XLC) fell 1.4%, 1.1%, and 1.1%, respectively on August 29.
Consumer discretionary stocks are under pressure from elevated inflation eroding purchasing power. Consumer sentiment fell about 8% in August, ending two consecutive months of improvement, with expected business conditions sinking 11% for the short run and 17% for the long run, according to the University of Michigan survey director Joanne Hsu.
Inflation expectations for the coming year rose to 4.3% in August from 4.2% in July, far above the 3.4% that prevailed before the Iran war.
Rising Treasury yields affect REIT performance — our real estate passive income guide explains how rate changes affect real estate investment returns
The Hidden Risk in Current Market Trends
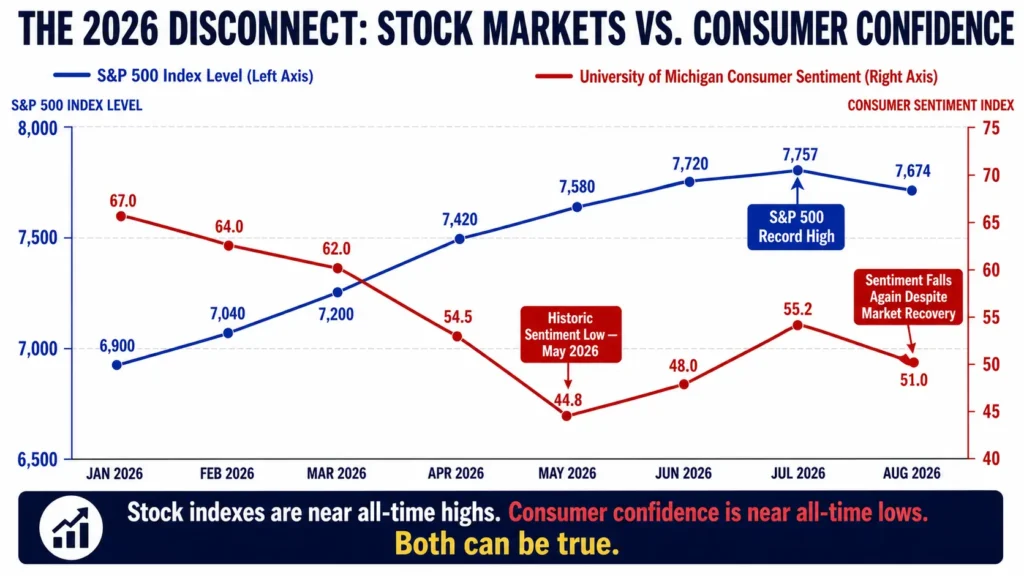
One of the most concerning signals in current stock market trends isn’t in the indexes themselves—it’s in consumer sentiment data.
The University of Michigan Index of Consumer Sentiment dropped to 51.0 in August from 55.2 in July. The index rose to 49.5 in June after sliding to a historic low of 44.8 in May.
This matters because consumer spending accounts for approximately 70% of US GDP. When consumers feel uncertain about the economy, they spend less, which eventually shows up in corporate earnings, which drives stocks lower. The current sentiment readings are historically low—suggesting that everyday Americans feel far less optimistic than stock index levels might suggest.
The Fed Rate Hike Question: September 2026
The single most important question for current stock market trends heading into September is whether the Federal Reserve will raise interest rates at its September meeting.
It does not appear likely that the Federal Reserve will cut interest rates in the second half of 2026, due to a spike in inflation and a stronger-than-expected job market.
The debate has now shifted from “when will the Fed cut?” to “will the Fed hike again?” This fundamental shift in expectations is a major driver of current volatility.
The S&P 500 rose on August 7 as traders interpreted an unexpected loss of jobs in July as meaning the Federal Reserve won’t need to raise interest rates soon and can leave monetary policy on hold for now. The broad market index advanced 0.62% for a record close of 7,757.64.
The record close came on weak jobs data that reduced rate-hike fears. But July nonfarm payrolls contracted by 23,000 jobs, far below the 83,000-job addition that Wall Street had expected. The labor market weakness created a brief window of optimism—but Warsh’s subsequent Jackson Hole hawkishness reversed the sentiment.
You can track these probability shifts in real time through the CME FedWatch Tool, which shows market-implied odds for each Fed meeting based on futures pricing.
What Analysts Are Watching for the Rest of 2026
For the stock market’s last six months of 2026, investors should continue to monitor Fed meetings, inflation data, and AI company earnings reports.
The key upcoming catalysts that could shift current stock market trends include:
The September Federal Reserve meeting, where the probability of a rate hike is currently 57.5%. Any CPI or PCE data that shows inflation meaningfully declining would reduce that probability and could push stocks significantly higher. Conversely, any Iran conflict escalation that pushes oil above $90/barrel would intensify inflation fears.
Investors can hedge by moving out of technology and into energy and healthcare. The AI bubble could burst, and inflation could remain higher for longer, prompting higher interest rates.
The median one-year forward estimate for S&P 500 stocks is nearly 13% per NDR data. That suggests Wall Street analysts remain broadly optimistic about the market’s direction, even with current headwinds.
Gold and Alternative Assets
Gold futures climbed to a three-month high on August 21, with December gold hitting $4,569.40 per ounce, its highest since May 15. The contract was on track for a fifth straight weekly gain, its longest winning streak since October 2025.
Gold’s strength reflects institutional hedging against both inflation and geopolitical risk. When stocks face uncertainty, institutional investors frequently rotate into gold as a hedge—and current stock market trends show this rotation is underway.
Disclaimer: This article presents factual data from verified financial news sources including CNBC, Yahoo Finance, Charles Schwab, Forbes, and Edward Jones as of September 1, 2026. It is not investment advice, financial advice, or a recommendation to buy or sell any security. Stock market data changes daily. Past performance does not guarantee future results. All index levels, sector performance figures, and economic statistics cited come from the referenced sources and reflect conditions at the time of reporting. Consult a licensed financial advisor before making any investment decisions based on market trends.
Conclusion
Current stock market trends in September 2026 reflect a market balancing three simultaneous forces: an AI boom pushing technology stocks to new records, persistent inflation keeping Federal Reserve policy uncertain, and geopolitical risk from the Iran conflict creating oil price volatility. The headline indexes look strong—Nasdaq up 16%, S&P 500 up 11% year-to-date—but the narrow breadth (only 17% of S&P stocks beating the index) and historically low consumer sentiment suggest significant fragility beneath the surface.
For investors watching these trends, the September Fed meeting is the near-term pivot point. A rate hike confirms the bearish inflation narrative; a hold confirms the cautious optimism scenario. Either outcome creates opportunity—but understanding which direction current stock market trends may move requires tracking the data that matters: CPI, PCE, oil prices, and Fed communications.
Want to understand the technical patterns behind these market moves? Our complete guide on how to read stock market charts shows you exactly how to read candlestick patterns, trend lines, and volume signals that experienced traders use to navigate markets like this one.
FAQ Section
Q1: What is the S&P 500 at today in 2026?
A: As of late August 2026, the S&P 500 has been trading in the 7,674-7,757 range. The index hit a record close of 7,757.64 on August 7, 2026. For exact real-time data, check CNBC Markets or Yahoo Finance directly, as prices change every trading session.
Q2: What is driving stock market trends right now?
A: Three forces are shaping current stock market trends: (1) The AI capital spending boom pushing technology stocks higher, (2) Sticky inflation above 3.4% annual rate creating Federal Reserve rate hike fears, and (3) The Iran conflict keeping oil prices elevated, which feeds inflation and geopolitical risk into market pricing.
Q3: Will the Fed raise interest rates in September 2026?
A: Market-implied probability stands at 57.5% for a 25 basis point hike at the September meeting, up sharply from 35.4% before Fed Chair Warsh’s hawkish Jackson Hole remarks. A hike would push the Fed funds rate to the 3.75-4% range. This is the single biggest near-term uncertainty for stocks.
Q4: Which stock market sectors are performing best in 2026?
A: Technology (XLK) leads with AI-driven gains. Energy benefits from Iran conflict oil price premium and AI data center electricity demand. Financials and crypto-adjacent stocks have also seen strength. Consumer staples, healthcare, and communication services are lagging because inflation pressure is weighing on consumer spending.
Q5: Why is consumer sentiment so low if stocks are near record highs?
A: The University of Michigan Consumer Sentiment Index fell to 51.0 in August 2026 from 55.2 in July—well below historical averages. Inflation expectations for the coming year rose to 4.3%, far above pre-Iran war levels of 3.4%. Everyday Americans experience inflation through grocery bills and gas prices—not through S&P 500 index levels. The disconnect between market performance and consumer confidence is a real and documented phenomenon in 2026.
Q6: Is the American stock market in a bull or bear market in 2026?
A: Technically still a bull market—all three major indexes are up year-to-date. But the market’s internal health is mixed. Only about 17% of S&P 500 stocks are outperforming the index itself, one of the lowest breadth readings in a decade. This suggests a narrow bull market concentrated in AI and technology, rather than a broad-based advance.

Financial enthusiast with 5 years of experience in the US market trends and personal wealth management